XAUUSD Market Analysis
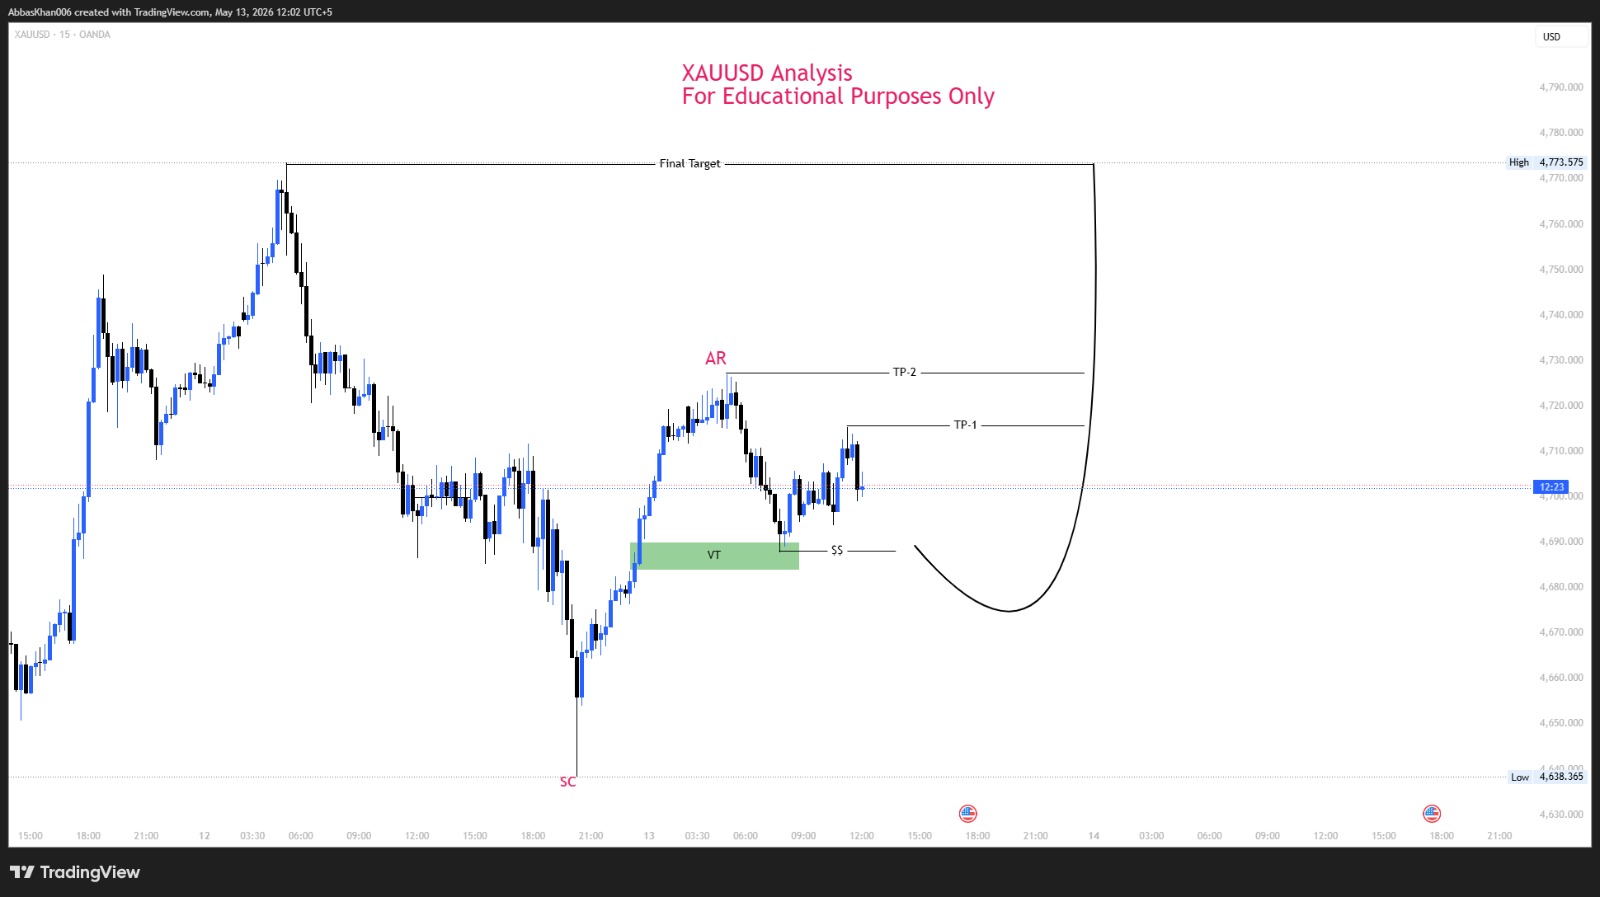
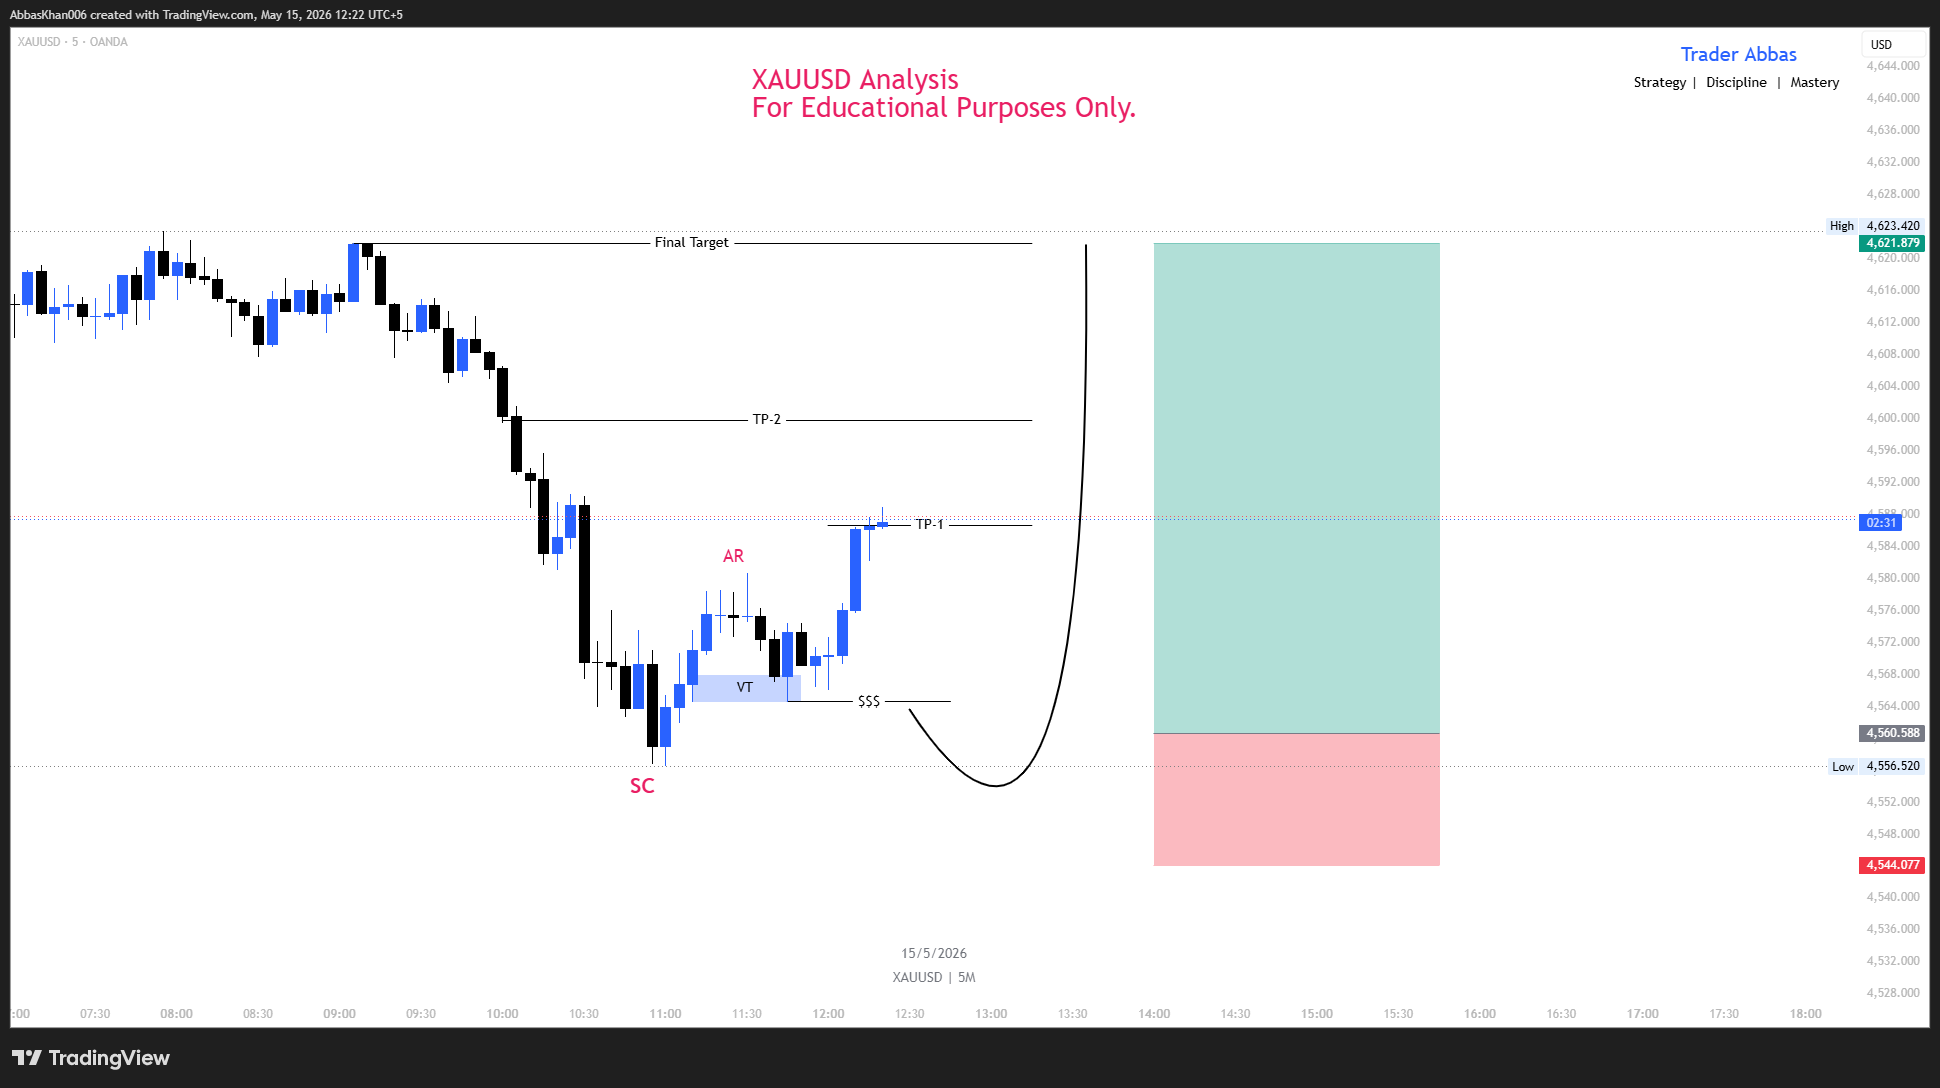
XAUUSD Price Prediction Today Gold (XAUUSD) is currently showing signs of a bullish Wyckoff accumulation structure after a major liquidity sweep toward the downside. The market formed a strong Selling Climax (SC), followed by an Automatic Rally (AR), indicating that buyers are gradually stepping back into the market. Price revisited the VT/SS demand zone successfully and reacted bullish once again. This behavior suggests that smart money may be accumulating positions before a potential continuation toward higher liquidity targets. If bullish momentum continues and price breaks above recent highs, XAUUSD could move toward TP-1, TP-2, and eventually the final target zone marked on the chart. Detailed XAUUSD Technical Analysis Market Context Gold is currently developing a classic Wyckoff accumulation pattern on the lower timeframe. After a strong bearish expansion, the market swept liquidity below previous lows and created the Selling Climax (SC). Soon after, buyers entered aggressively and pushed the market upward, forming the Automatic Rally (AR). This shift indicates that bearish pressure may be weakening while institutional buyers begin positioning for a potential bullish expansion. Key Structural Points Selling Climax (SC) The market formed a sharp impulsive low near the 4638 area, where panic selling appeared exhausted. This level became the foundation of the current accumulation range. Automatic Rally (AR) Following the SC, price expanded aggressively upward, confirming buyer strength and defining the upper boundary of the trading range. Secondary Test / Spring Phase The green demand zone marked as VT/SS represents a revisit into previous liquidity. Price respected this area successfully and reacted bullish, showing that sellers failed to maintain downside control. Why This Reaction Matters Liquidity below lows has already been collected Bearish momentum is weakening Buyers defended the demand zone strongly Market structure is shifting bullish Bullish Scenario for XAUUSD If price continues holding above the VT/SS demand zone, bullish continuation becomes increasingly likely. Expected Market Path Internal liquidity collection Break above short-term highs Move toward TP-1 Expansion toward TP-2 Potential continuation toward the final target zone The curved projection on the chart suggests that temporary consolidation or manipulation may occur before the larger bullish expansion begins. Important XAUUSD Price Zones Demand Zone The highlighted green area remains the key bullish defense zone. As long as price respects this region, buyers maintain short-term control. TP-1 First liquidity target where partial reactions or profit-taking may appear. TP-2 Major resistance and external liquidity zone. A breakout above this area could trigger stronger bullish continuation. Final Target The final upper target represents a larger liquidity objective where the market may seek resting buy-side liquidity. Smart Money & Trading Psychology The market often moves against retail expectations before the real directional move begins. The sweep below lows likely trapped aggressive sellers while forcing weak buyers out of the market. This behavior is commonly seen during smart money accumulation phases: Fear enters near lows Liquidity gets collected Institutions accumulate positions Expansion follows afterward Gold rarely moves cleanly from the start. First comes confusion, then comes direction. Classic XAUUSD behavior. Keywords XAUUSD analysis, Gold price prediction, XAUUSD forecast today, Wyckoff accumulation, Smart money concept, Gold technical analysis, Forex gold analysis, XAUUSD buy setup, Liquidity sweep trading, Gold market outlook Disclaimer This analysis is shared for educational purposes only and does not constitute financial advice. Always use proper risk management and wait for confirmation before entering any trade setup.